Welch’s T-Test Online Calculator
A better way to perform your statistics
Automated calculations
When using EasyMedStat, all the calculations will be performed automatically including the p-value and the numeric distributions (mean, standard deviation, …) of both groups.
What to write in my article?
In addition to the automated calculations, you will be provided with two texts to insert directly into your article: one for the methods section and one for the results section describing exactly the result of your test and the statistical methods used.
Vivid & Clear Professional Charts For Your Article
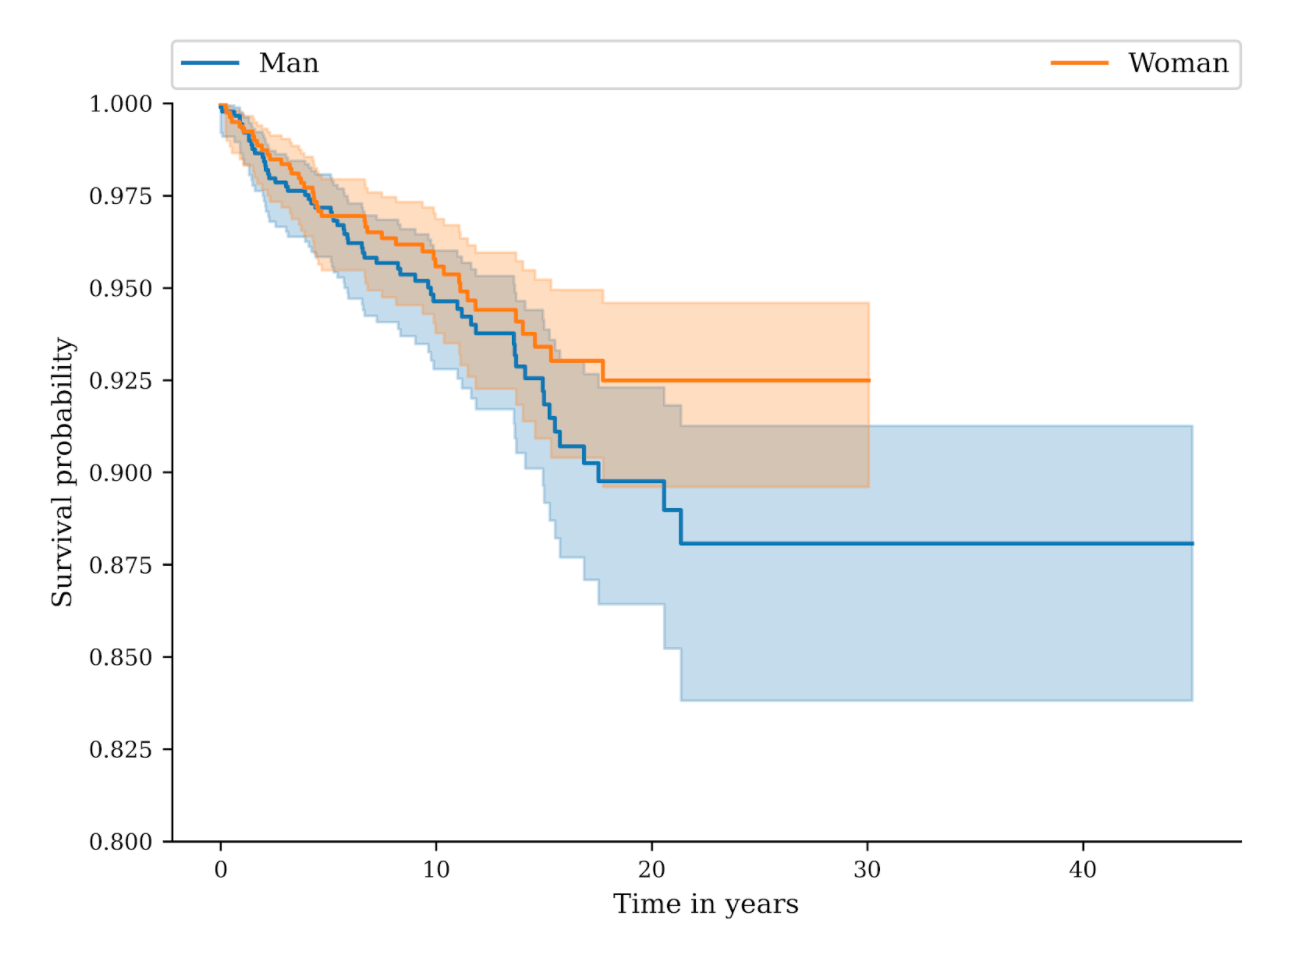
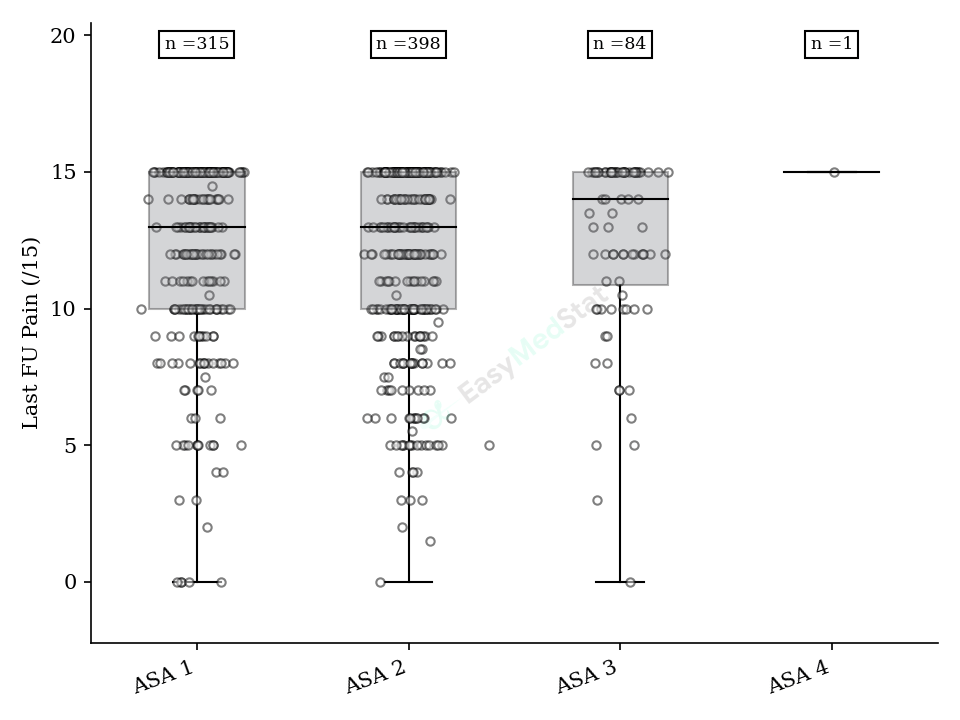
EasyMedStat automatically generates stunning charts based on your data (box plots, bar charts, dot plots, …), then lets you download them to include in an article or publication.
What is Welch's t-test?
The Welch’s t-test is an adaptation of Student’s t-test. It is used in medical studies when the assumption of the equality of variances in Student’s t-test is not met. It is used to compare the distribution in two independent groups of patients. One usage would be to compare the BMI of patients with or without diabetes. The independent sample t-test is also used in the same context as the Mann-Whitney U-test.
Can I use Student’s t-test instead of Welch’s t-test?
No. If the two groups have unequal variances, you should not use Student’s t-test. However, when using EasyMedStat, the most appropriate test will automatically be chosen automatically according to your data so you do not have to worry if you can use this test or not. EasyMedStat does all the work for you.
Can I always use Welch’s t-test to compare two means?
The quick answer is: No. To use Welch’s t-test, you need to respect the assumption of normality and your groups must be independent. The normality of the samples is usually checked with the Shapiro-Wilk test or the Kolmogorov-Smirnov test. The independence of the two groups is also very important. But, again, when you use EasyMedStat, you do not have to worry about all these complicated details. EasyMedStats picks the most appropriate test for you according to your data and your clinical question.


