

Kaplan-Meier Survival Analysis Online Calculator
A better way to perform your statistics
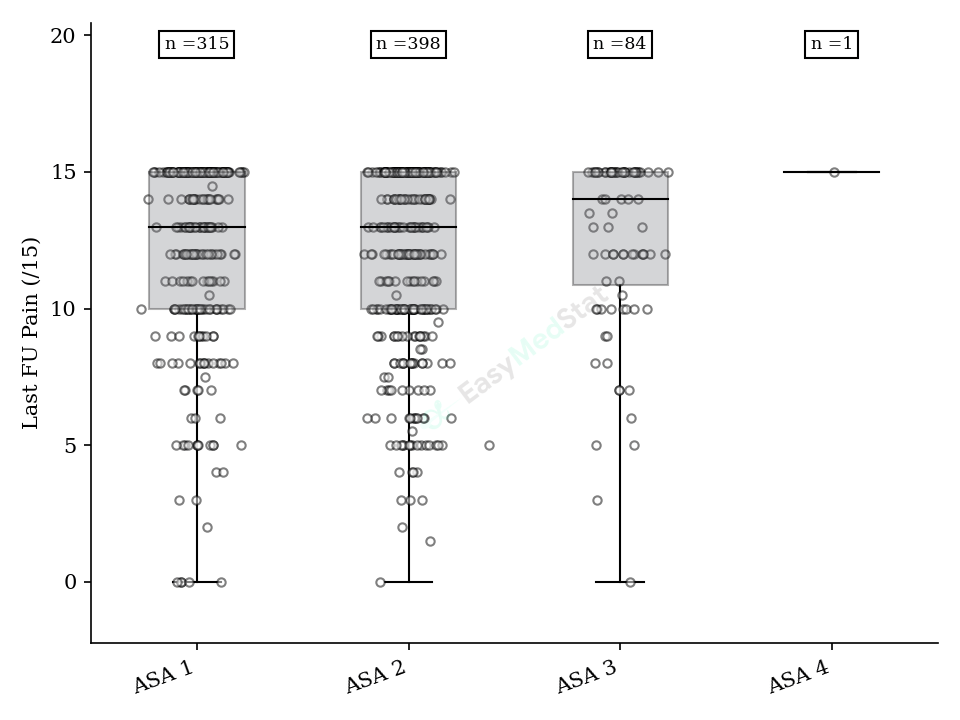
Automated survival curves
Survival curves are automatically generated from your data. Charts can be downloaded in high definition (600 dpi) and added directly to your publication or presentation. Several templates are available to best fit your needs.
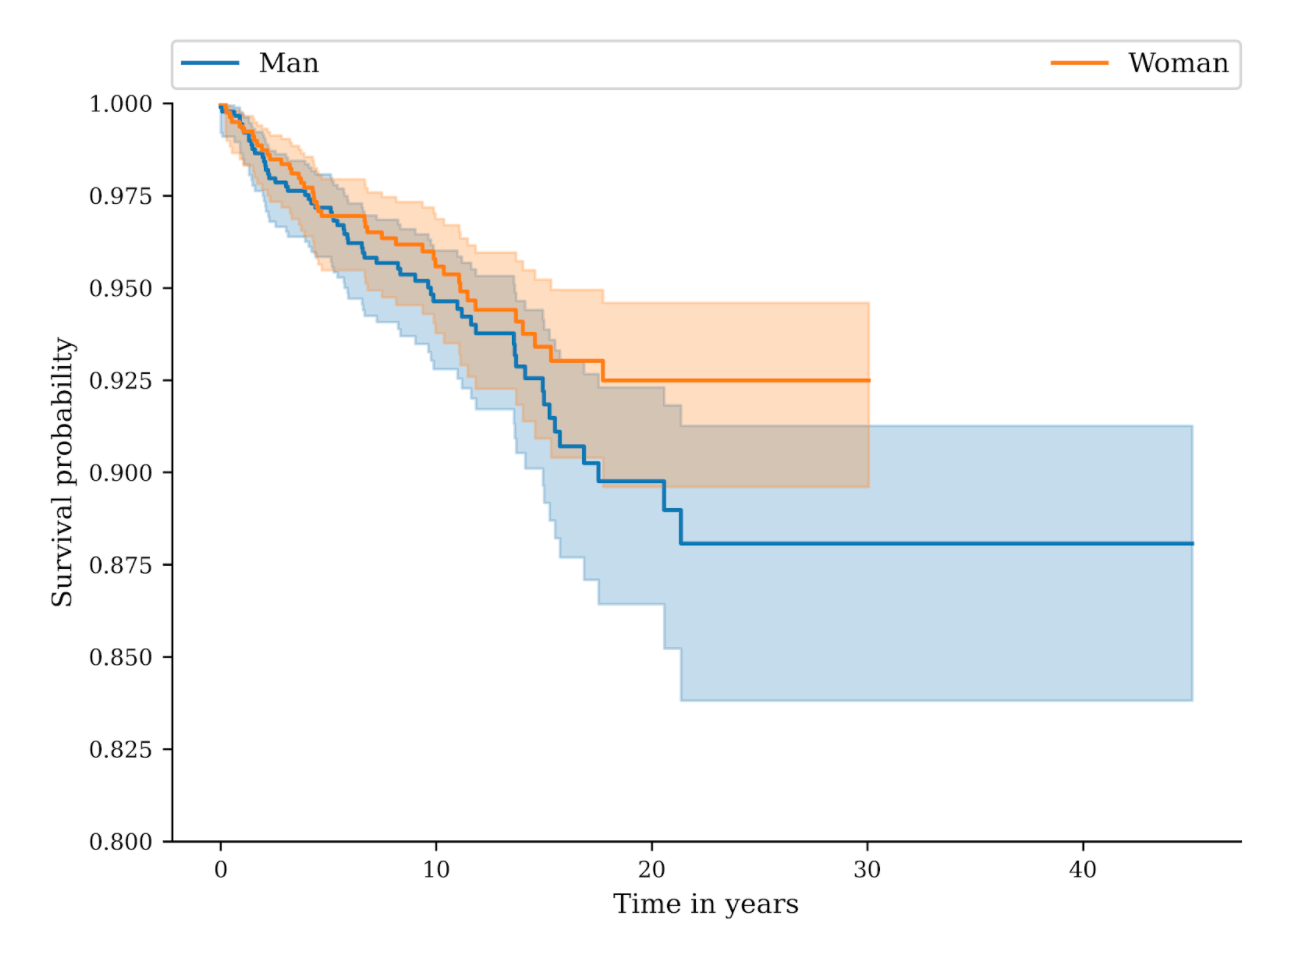
Compare survivals between groups of patients
You can easily compare the survival rates in different groups of patients thanks to our automated analysis tool. The Log-Rank test is automatically performed when you compare groups. The p-value and the survival rates of each group are calculated and provided for inclusion in your article.
Calculate Kaplan-Meier confidence intervals
95% confidence intervals are calculated at each delay to provide you with the survival of your patients. These confidence intervals are also plotted on the survival curves.
What is a Kaplan-Meier analysis?
The Kaplan-Meier estimator is a statistic used to estimate a survival function. The survival function is used to estimate the time before an event occurs. The most common event studied in medical studies is death, but it can also be the recovery, the change of a score value, the success or the failure at a clinical test, etc.
The survival function thus estimates the probability that the time until event is greater than t. Then, EasyMedStat will determine for each patient and each date point the statistic of the survival function. A confidence interval is also calculated at each time point to estimate the error which can be expected (log-log method).
How to compare the survival of different groups of patients (Log-Rank test)?
Just pick the variable you want to use for comparison and all the calculations are done automatically. For example, choose "Gender" to compare the survival between women and men. The application will perform a Log-rank test and provide you with the p-value and the survivals of each group.
How do I prepare my data for analysis?
It is very easy! All you need to do is to provide the date of inclusion in the study for each patient and, if the event occurred, the date where the event happened. You do not need to calculate the delay or anything else. You can import an Excel file, a CSV file or simply add your patients one after the other if you do not have an Excel file.