Blog
"Test variables" has been fully revamped [Product Update 3.11]
ROC Curves
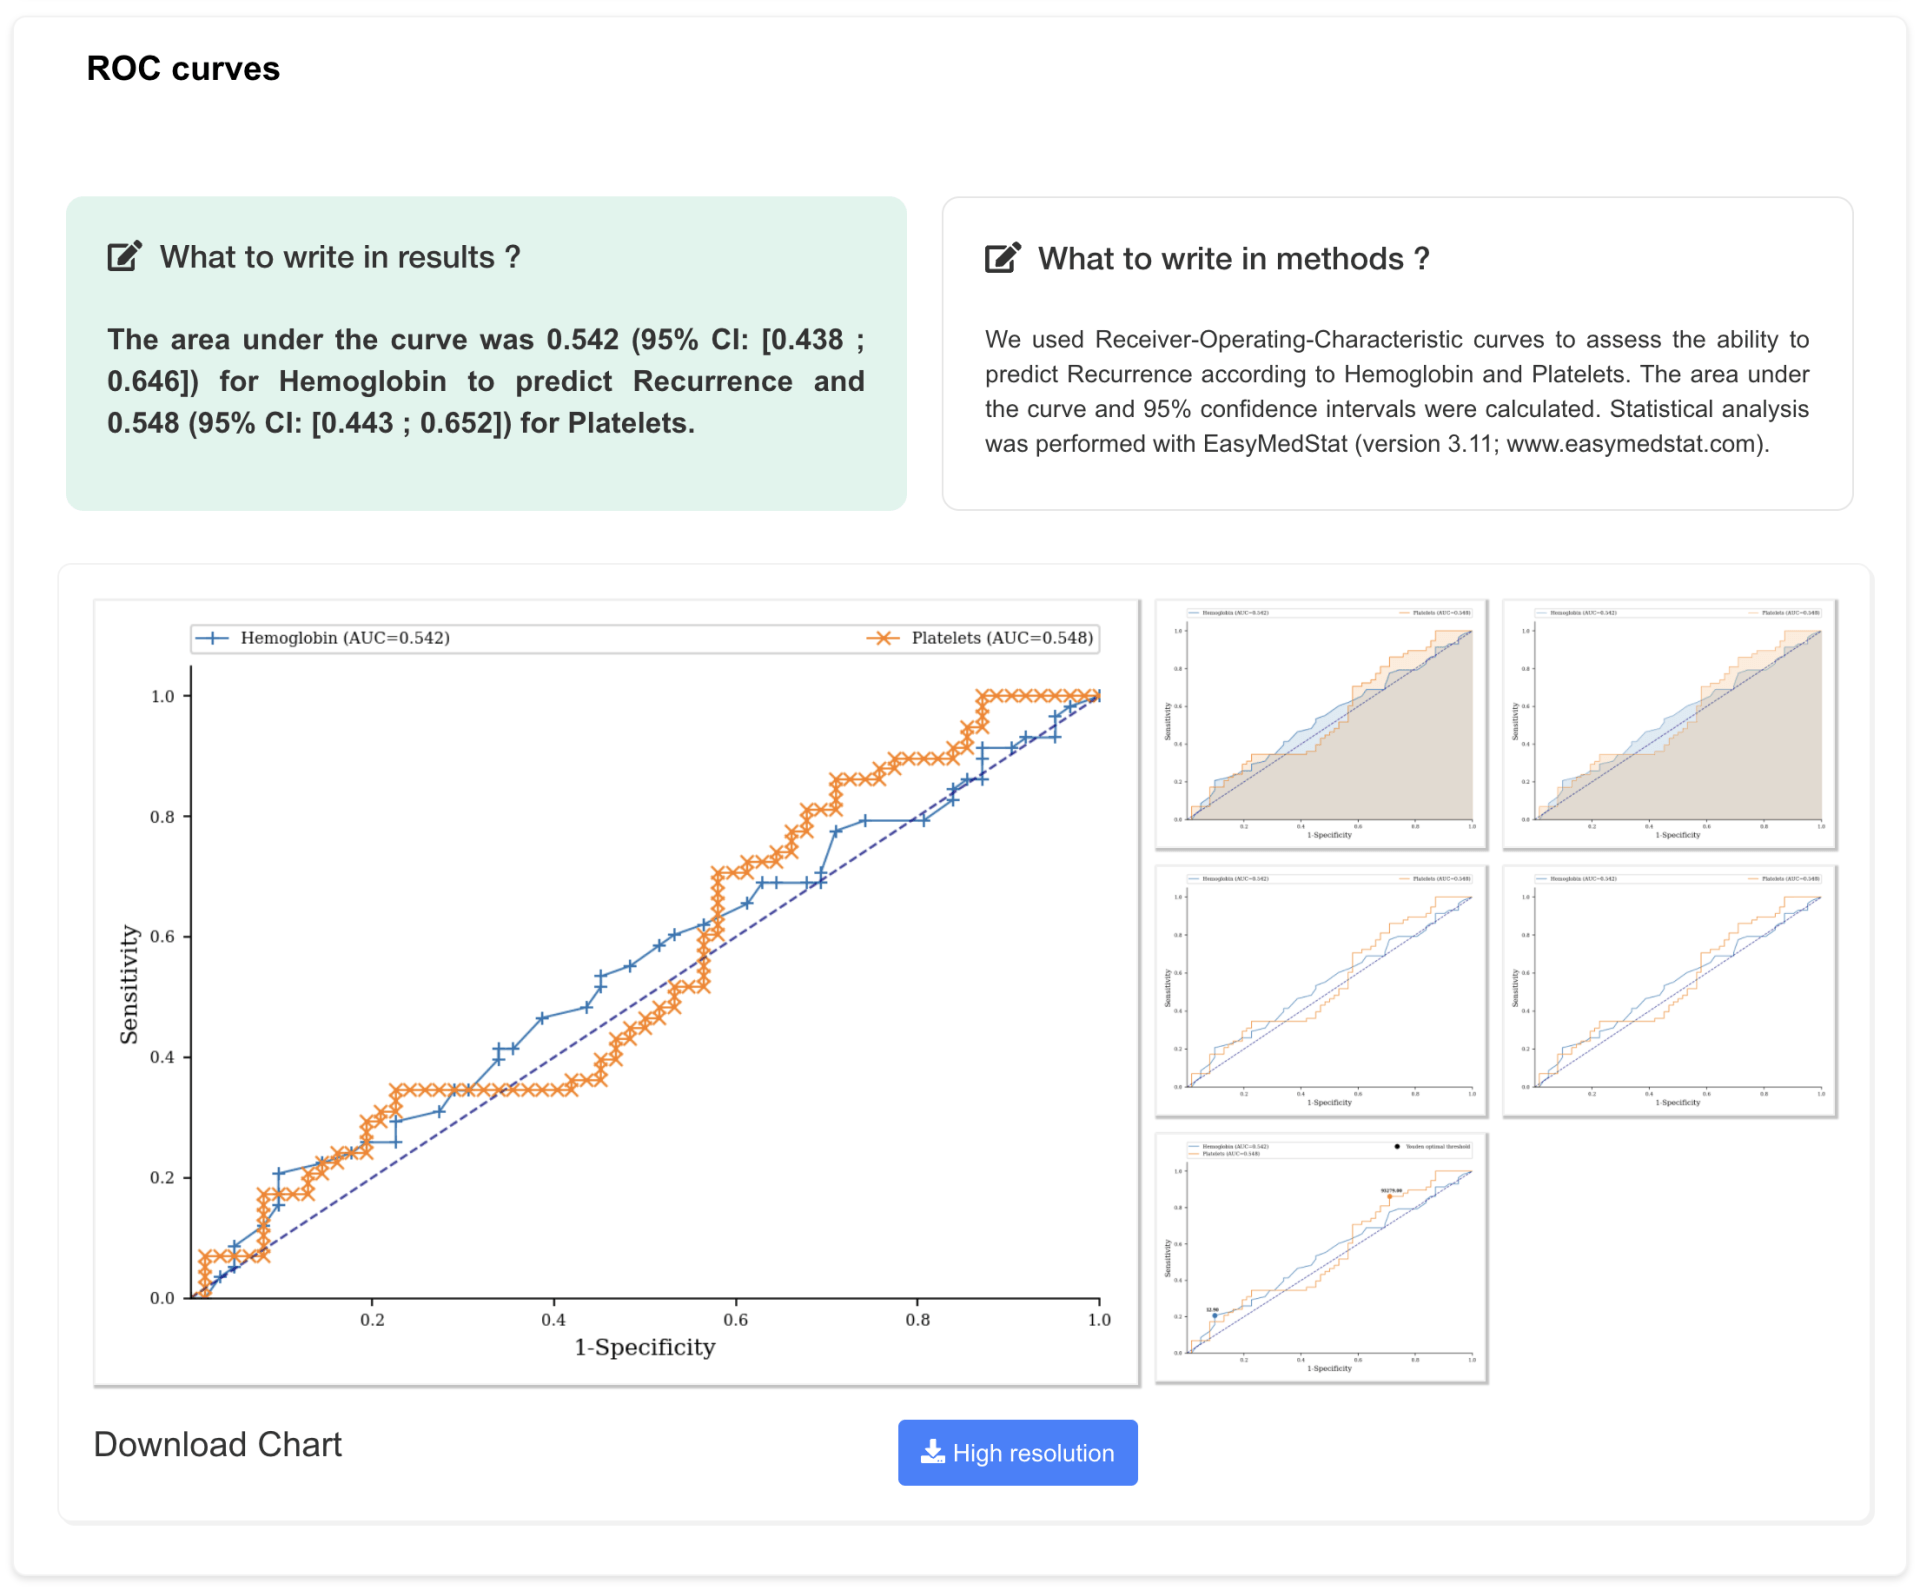
You can now generate ROC curves seamlessly. Pick a Yes-no variable and a Numeric variable and your ROC curve will pop up. The curve will describe the ability to classify the Yes-no variable as Yes or No according to the values of the Numeric variable. A table with sensitivity and specificity for each threshold is also created.
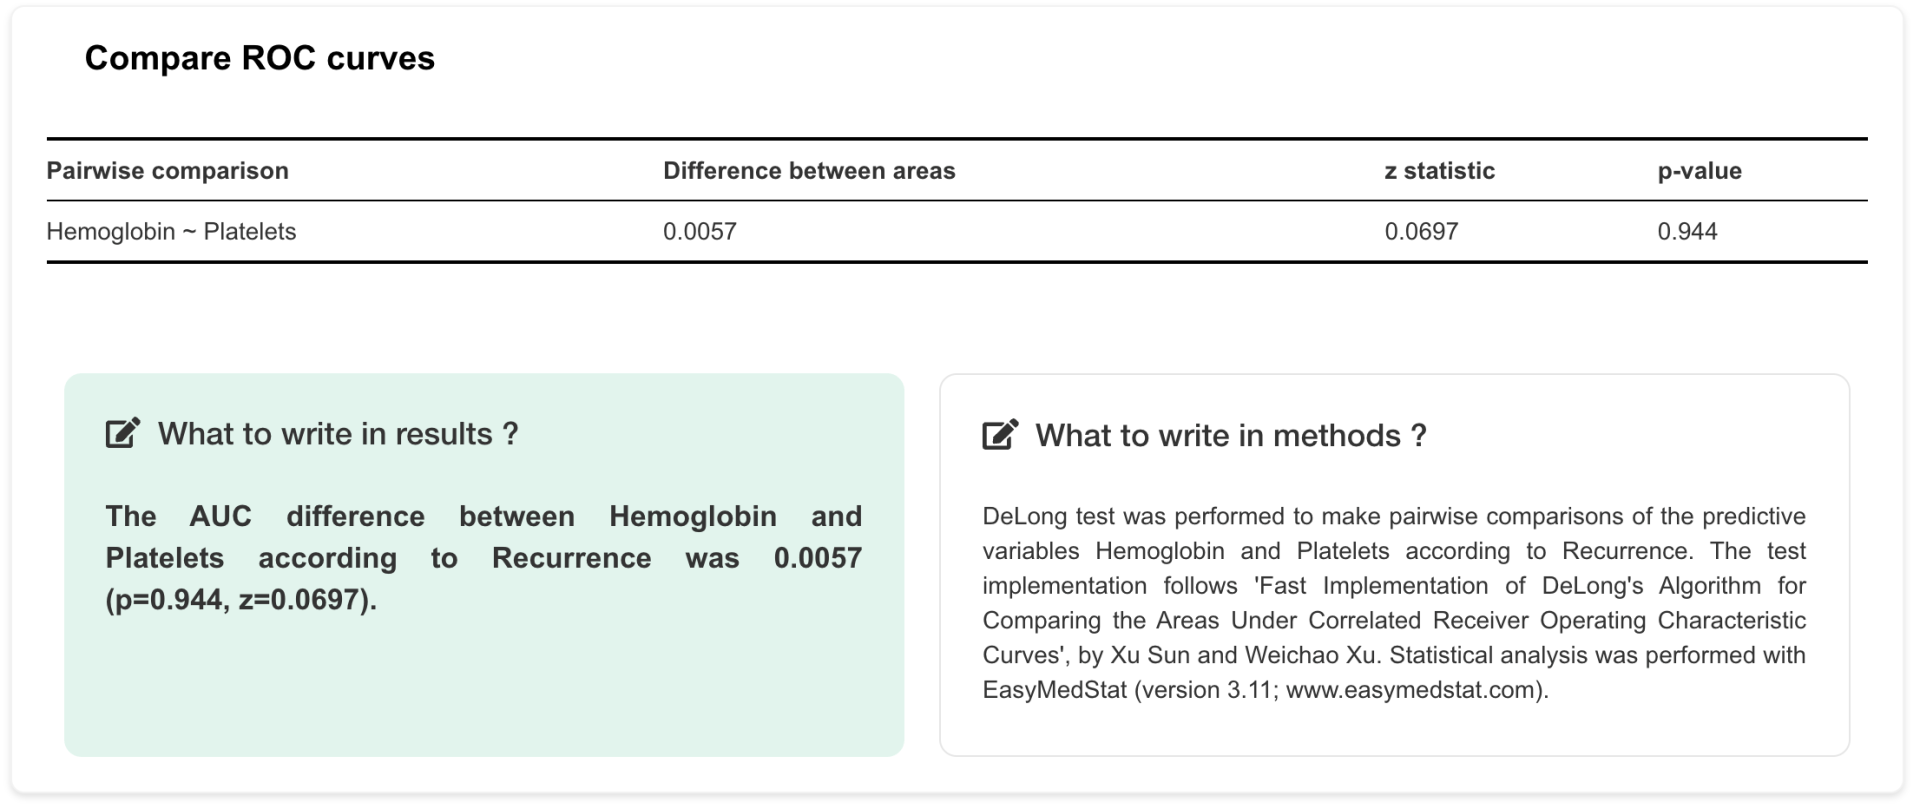
You can also compare several ROC curves by comparing their area under the curve (AUC). A DeLong test is automatically performed when you add more than one Numeric variable.
Numeric Variable Discretization
You have a Numeric variable but would prefer to analyze it as a List or Yes-no variable? It is now possible.
You can transform a Numeric variable into a discrete variable with several groups.
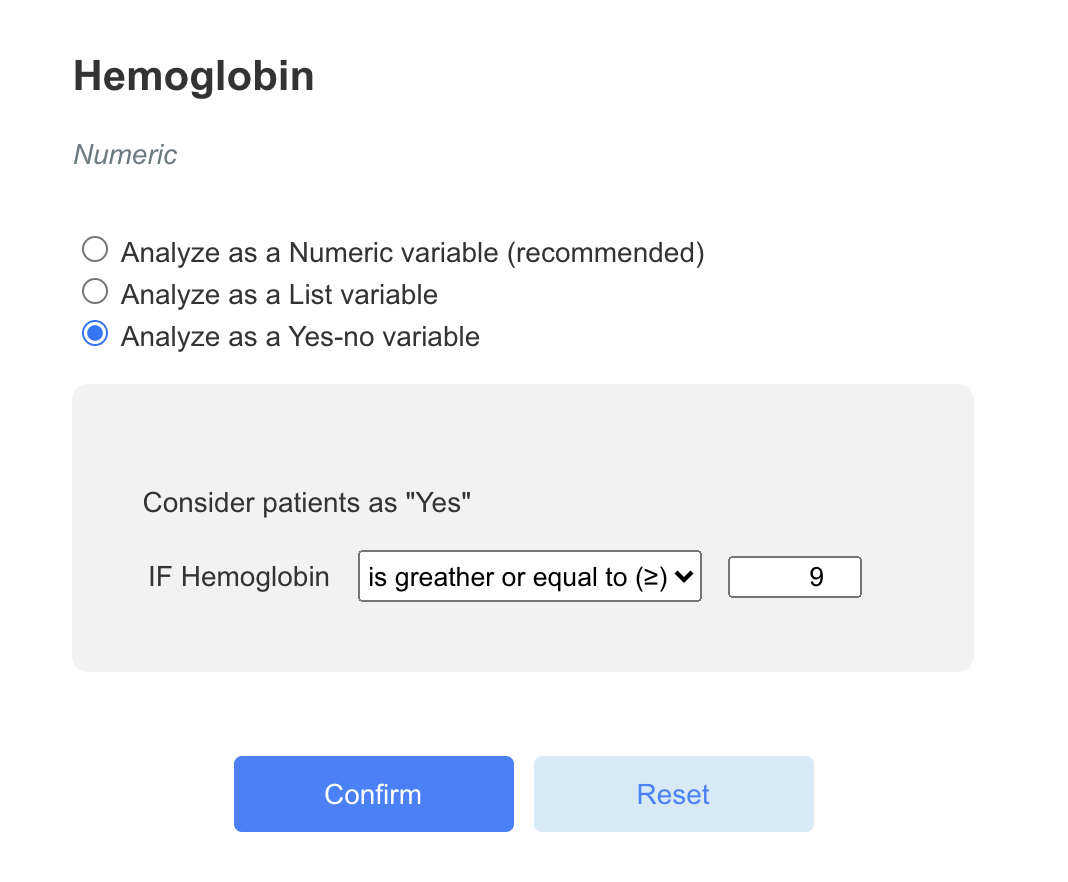
Let’s say you have a Numeric variable called “Hemoglobin” and you want to split it into two groups: patients who have at least 9 g/dL of hemoglobin and patients who have less than 9 g/dL. Just click on the settings button next to the name of the variable and a menu will appear.
You can create up to 7 groups from a Numeric variable.
Reorder modalities of a List variable
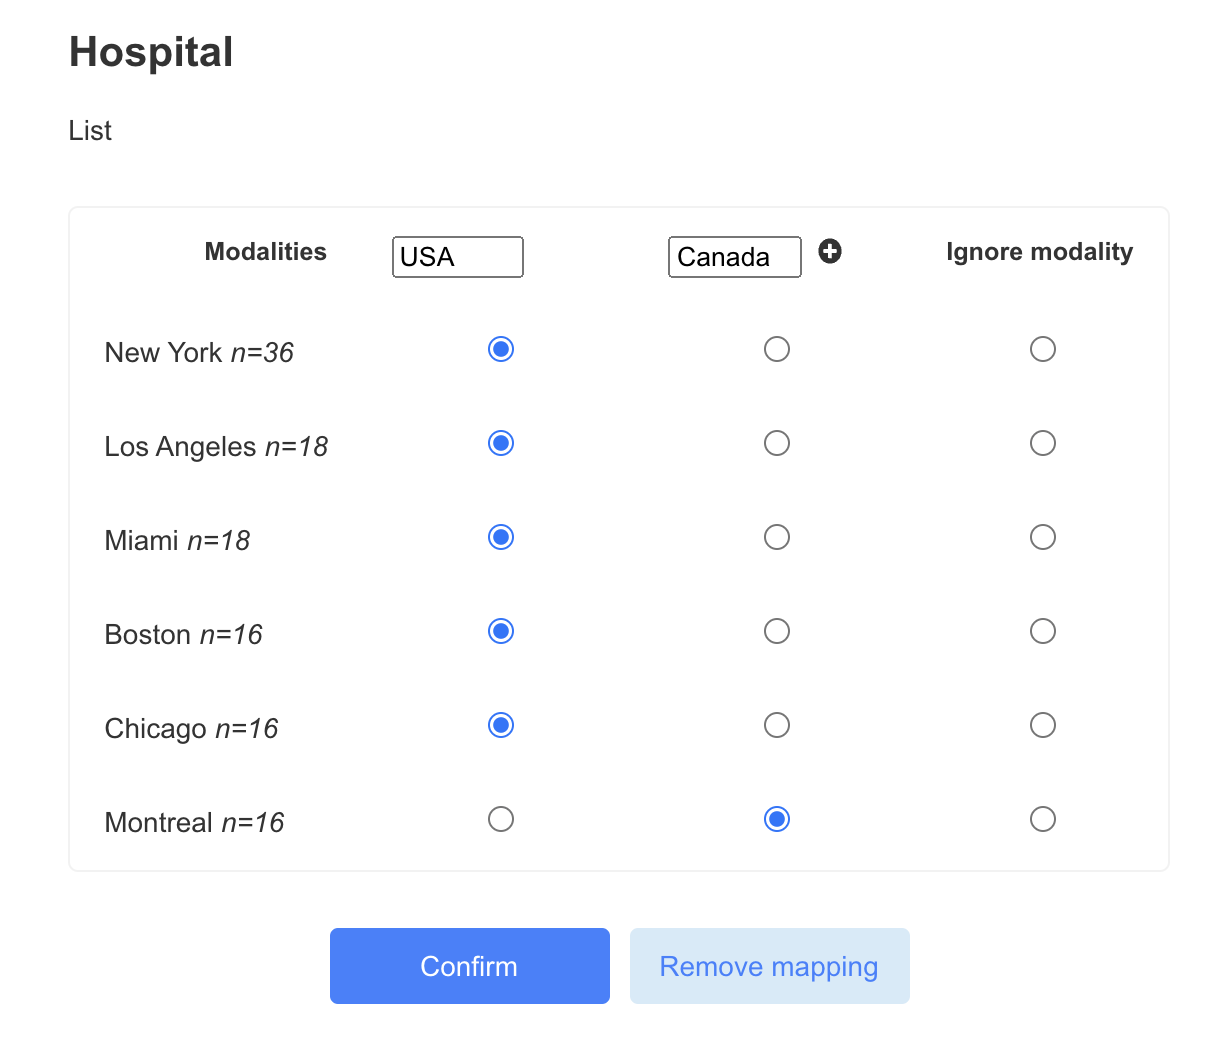
You can now reorder modalities of a List variable.
Let’s say you have a “Hospital” variable with 6 possible values (modalities): New York, Los Angeles, Miami, Boston, Chicago and Montreal. You may want to compare hospitals from the USA to Montreal. You can now group the 5 modalities corresponding to the USA in a single group.
Every combination is possible!
Generate a Descriptive Table
Simple but so powerful! You can generate a table describing your population to add into your article. Just pick the variables to include in your table and click on “Descriptive Statistics”.
This table can then be copied and pasted into a Word document.
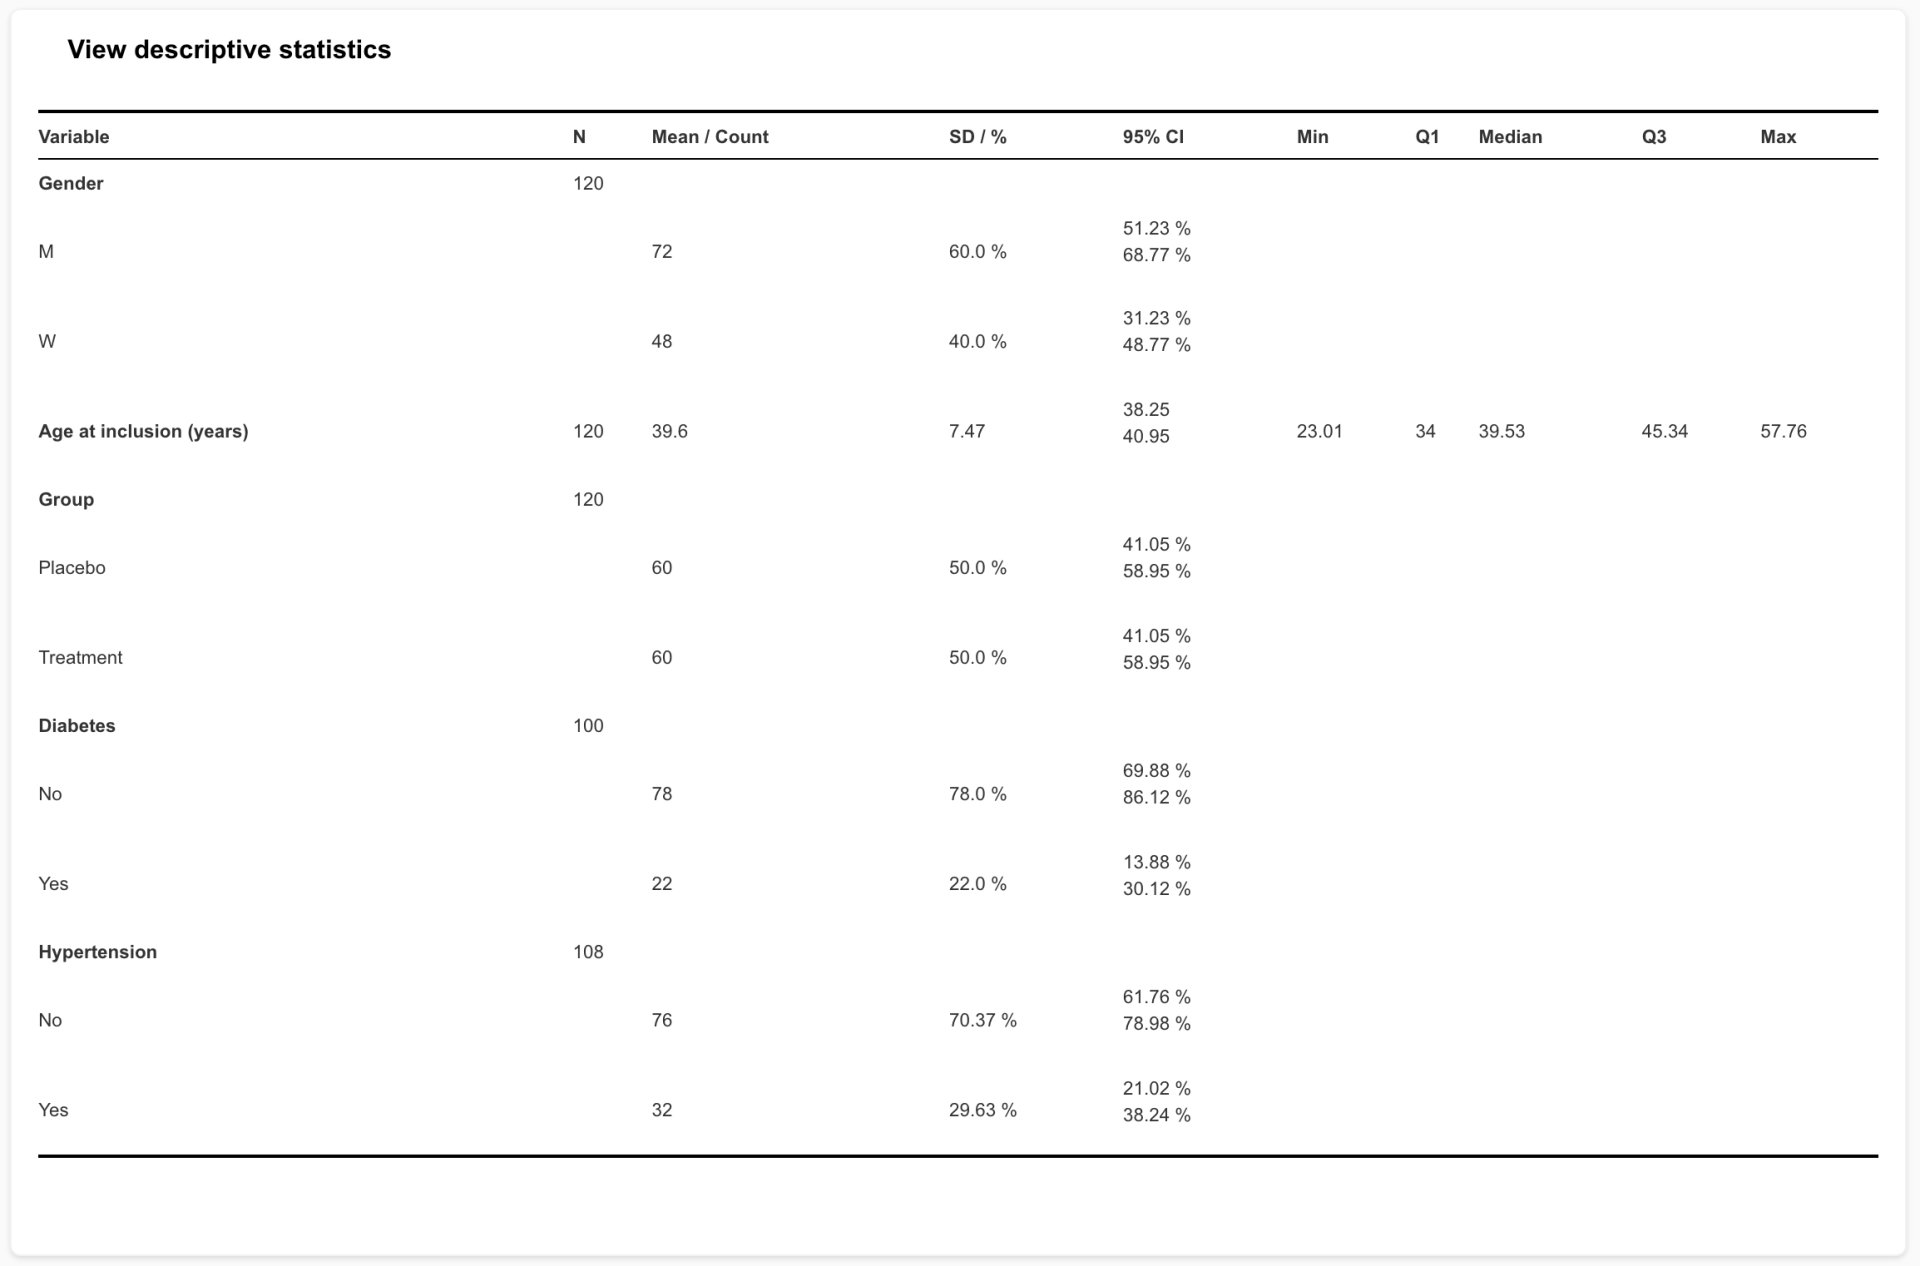
We hope you liked all these new capabilities and will come back soon with many more!
LATEST POSTS
Risques compétitifs : méthodes d’Aalen-Johansen et test de Gray désormais intégrées dans EasyMedStat




Let your friends know!


