McNemar’s Test Online Calculator
A better way to perform your statistics
Automated calculations
When using EasyMedStat, all the calculations will be performed automatically including the p-value and the numeric distributions (mean, standard deviation, …) of both groups.
What to write in my article?
In addition to the automated calculations, you will be provided with two texts to insert directly into your article: one for the methods section and one for the results section describing exactly the result of your test and the statistical methods used.
Vivid & Clear Professional Charts For Your Article
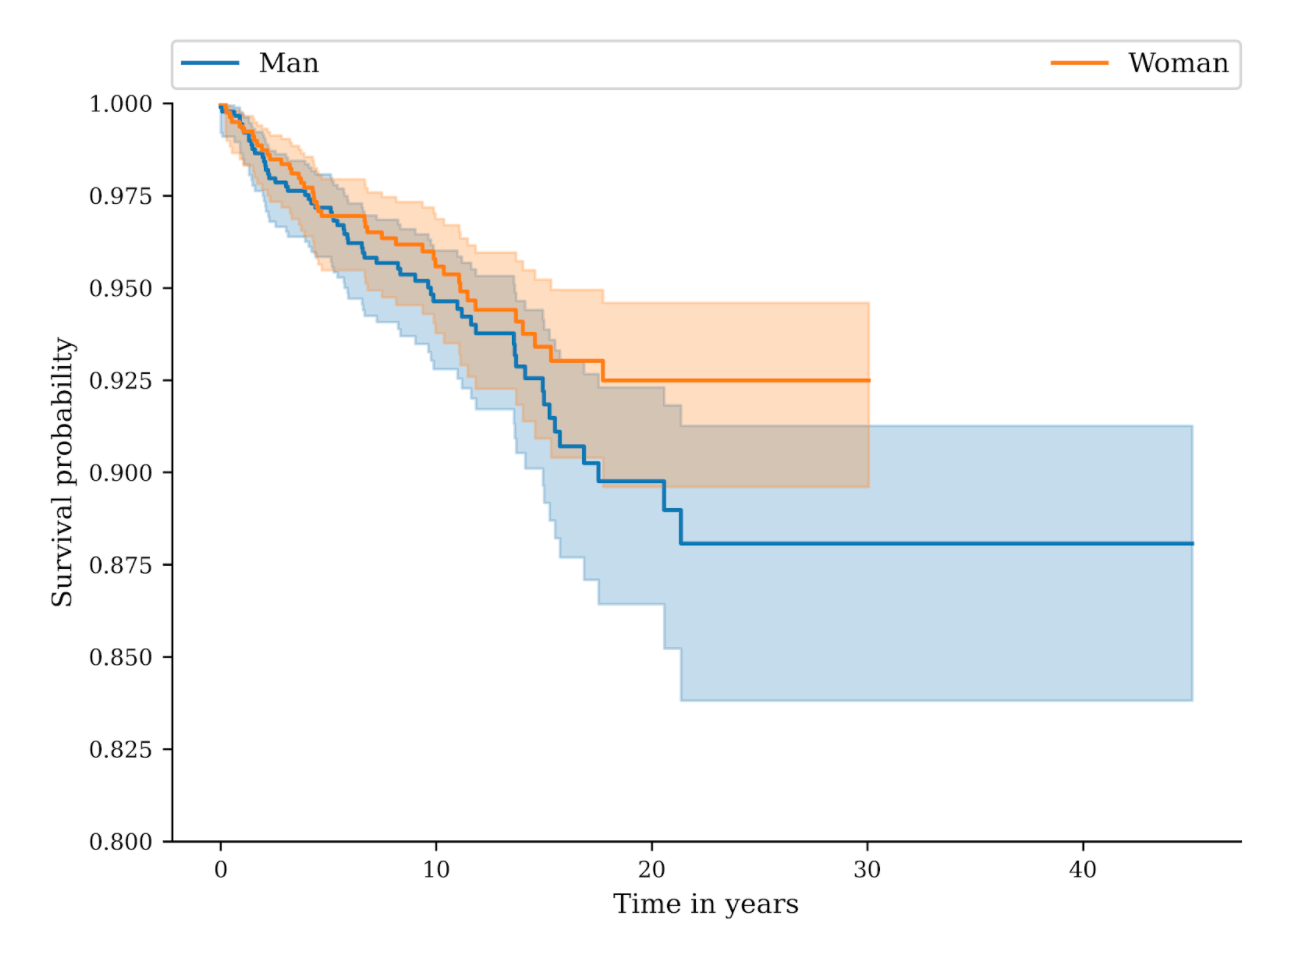
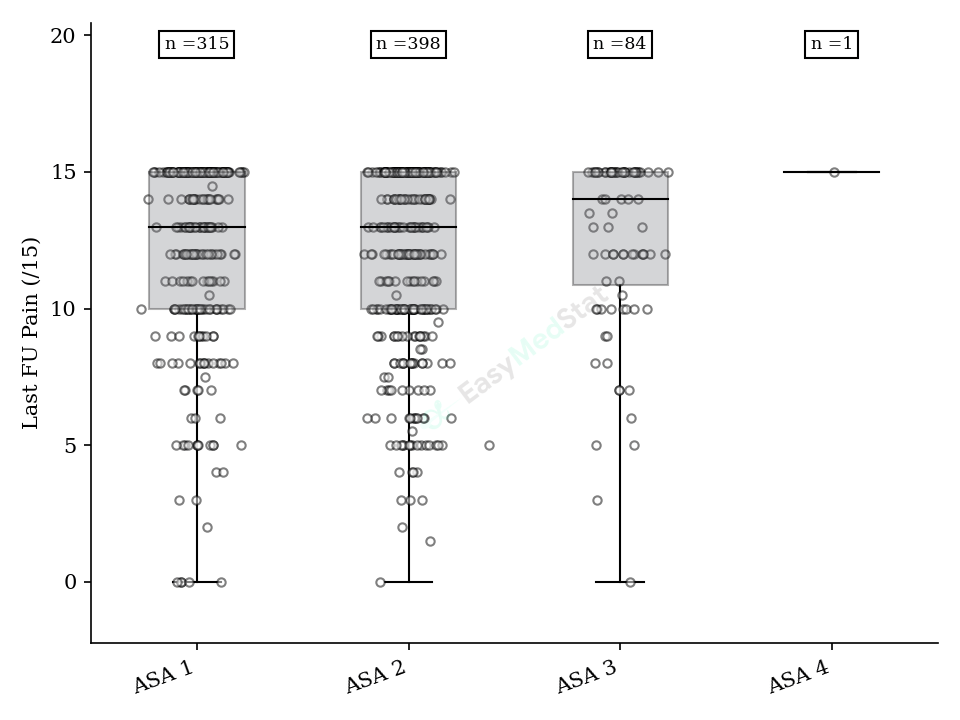
EasyMedStat automatically generates stunning charts based on your data (box plots, bar charts, dot plots, …), then lets you download them to include in an article or publication.
What is McNemar's test?
McNemar's test is used in clinical research to compare the proportion of two dependent binary (yes/no) variables. In most cases, it is used to compare the pre-treatment and post-treatment proportion of the same variable. For example, let’s say that you perform a study about a surgery for anterior cruciate ligament repair. You want to study if patients' ability to practice sports improved after surgery. You, therefore, compare the proportion of patients who practiced sports before surgery and the proportion of the same patients who practiced sports after surgery. This is a scenario in which you should use McNemar's test.
Can I use a Fisher’s test or the Chi-squared test instead of a Mann-Whitney test?
No, you should not use Fisher’s exact test or the Chi-squared test when comparing pre-treatment and post-treatment proportions in the same patients. However, when using EasyMedStat, the most appropriate test will automatically be chosen according to your data and your clinical question, so you do not have to worry if you can use this test or not. EasyMedStat does all the work for you.
Can I use McNemar’s test for more than 2 repeated measures in time?
No, McNemar’s test is only used to compare 2 variables— for example, preoperative and postoperative proportions. If you want to study a variable that is repeated more than two times, you should use another test such as the Cochran’s Q test.


