


Blog
Is your study fragile? Product update v3.21
Like you, we are always happy when we can validate the hypothesis of our clinical study by obtaining a p-value < 0.05 on our main hypothesis.
But is this result robust? Could the fate of a single patient modify the p-value and cause it to pass beyond the sacrosanct threshold of “significance”?
You will now be able to answer this question very easily thanks to EasyMedStat. We also have new features on the ROC curves side. Read on carefully to find out more…
Fragility Index
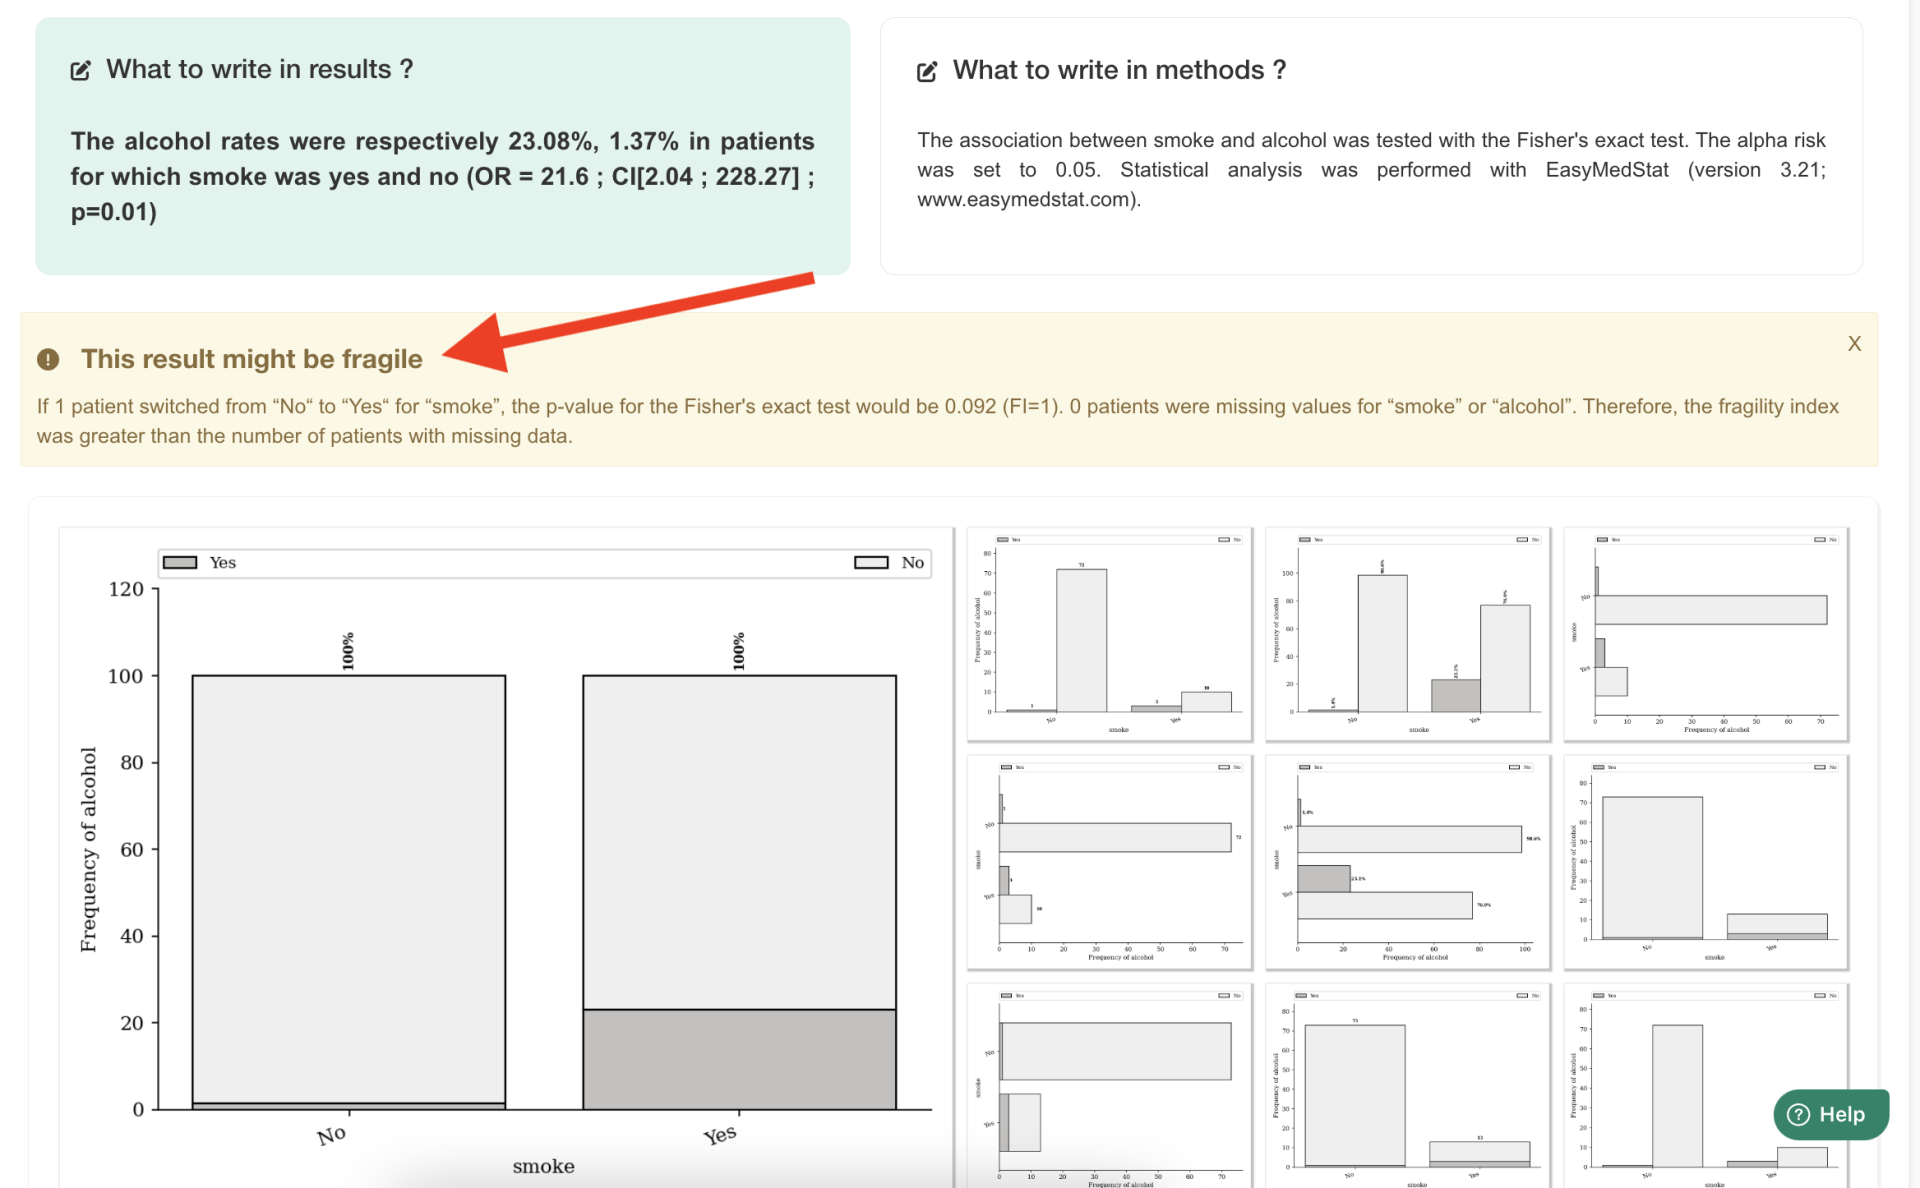
The Fragility Index is a statistical indicator of the robustness of your statistical result. It applies in the case of a comparison between two groups on a binary criterion. For example when comparing the rate of complications between a treatment and a placebo.
This indicator was described by Walsh in 2014 and calculates the number of patients needed to raise the p-value of the statistical test above 0.05 when it is initially “significant”.
If for a statistical test we obtain a p-value < 0.05 and the fragility index equals 2, then if only 2 patients presented a different result, the p-value of the test would become greater than 0.05.
This index is only calculated for Fisher's tests of Chi-square.
To use it on EasyMedStat,
go to “Test variables”, choose 2 variables “Yes-no” then open the panel “Find an association between …”. Go down to the bottom of the panel and click on “Is this result fragile?”. If the p-value of your test is < 0.05 then the fragility index will be calculated. Furthermore, the fragility index is automatically compared to the number of patients with missing data. If this index is lower than the number of patients for whom data are unknown, this reinforces the doubt about the robustness of the result.
Note that the fragility index is only calculated for samples of less than 100 patients for the moment for performance reasons.
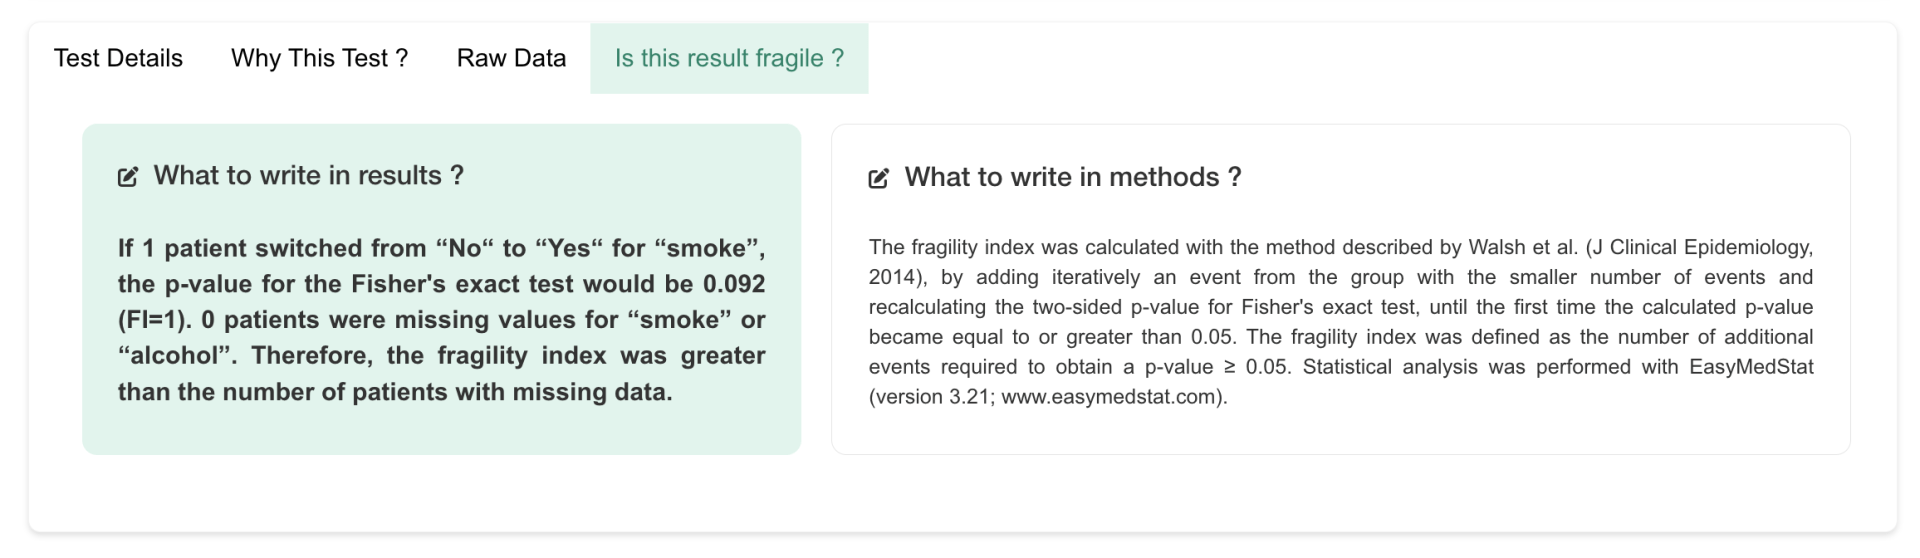
Finally, if your fragility index is equal to 1 or if it is less than the number of patients with missing data, an alert message is automatically displayed under the result of your statistical test in a yellow box.
Positive and Negative Predictive Values
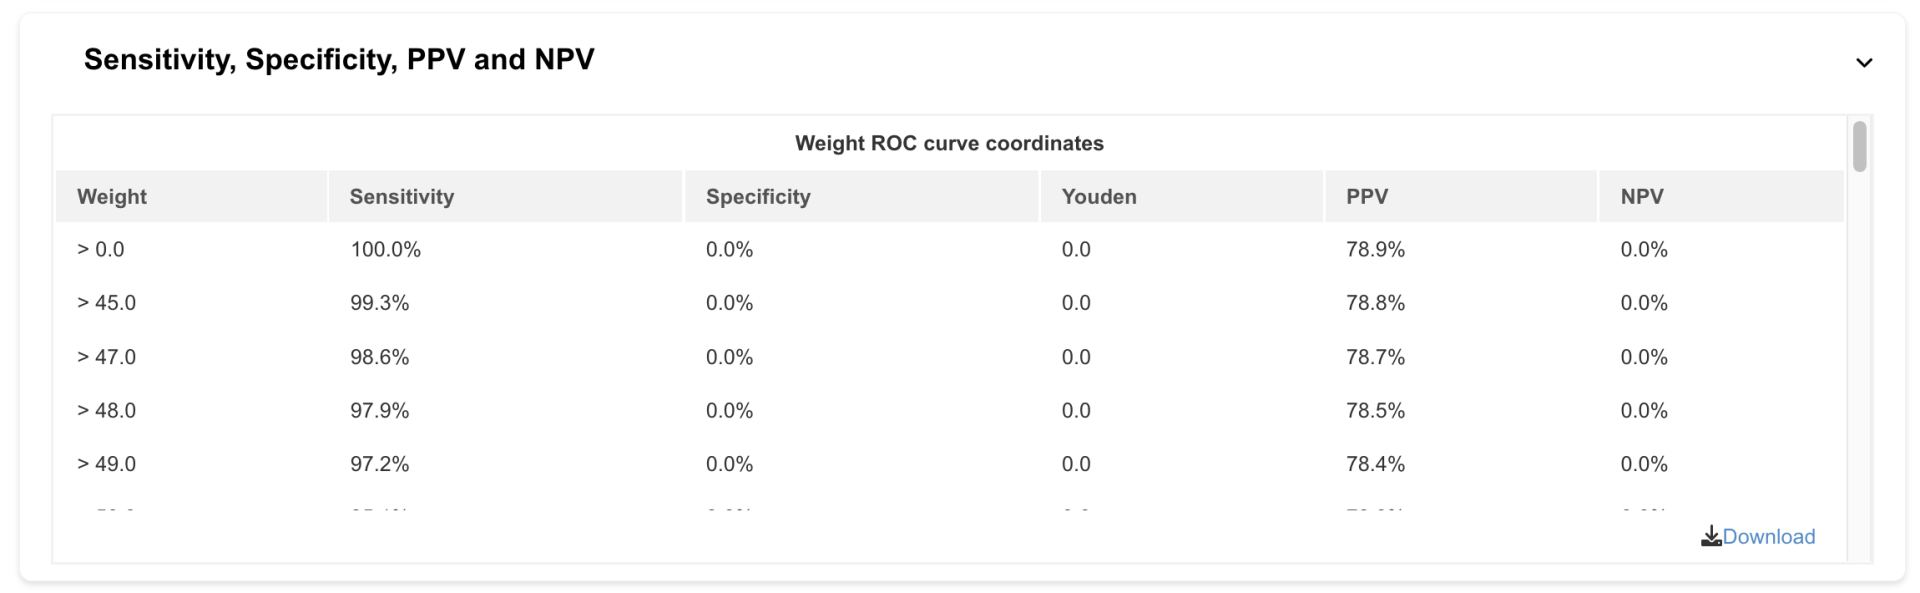
Another new feature in this release is the ability to automatically calculate PPV and NPV when studying ROC curves.
To use it on EasyMedStat, go to “Test variables” then choose a “Yes-no” variable and a “Numeric” variable. Open the “ROC curves” panel then scroll down until you see the “Sensitivity, specificity, PPV and NPV” panel.
You will then find in addition to the sensitivity and the specificity, the PPV and VPN for each threshold of your numerical variable.
LATEST POSTS
Risques compétitifs : méthodes d’Aalen-Johansen et test de Gray désormais intégrées dans EasyMedStat


Let your friends know!