Mann-Whitney U-test Online Calculator
A better way to perform your statistics
Automated calculations
When using EasyMedStat, all the calculations will be performed automatically including the p-value and the numeric distributions (mean, standard deviation, …) of both groups.
What to write in my article?
In addition to the automated calculations, you will be provided with two texts to insert directly into your article: one for the methods section and one for the results section describing exactly the result of your test and the statistical methods used.
Vivid & Clear Professional Charts For Your Article
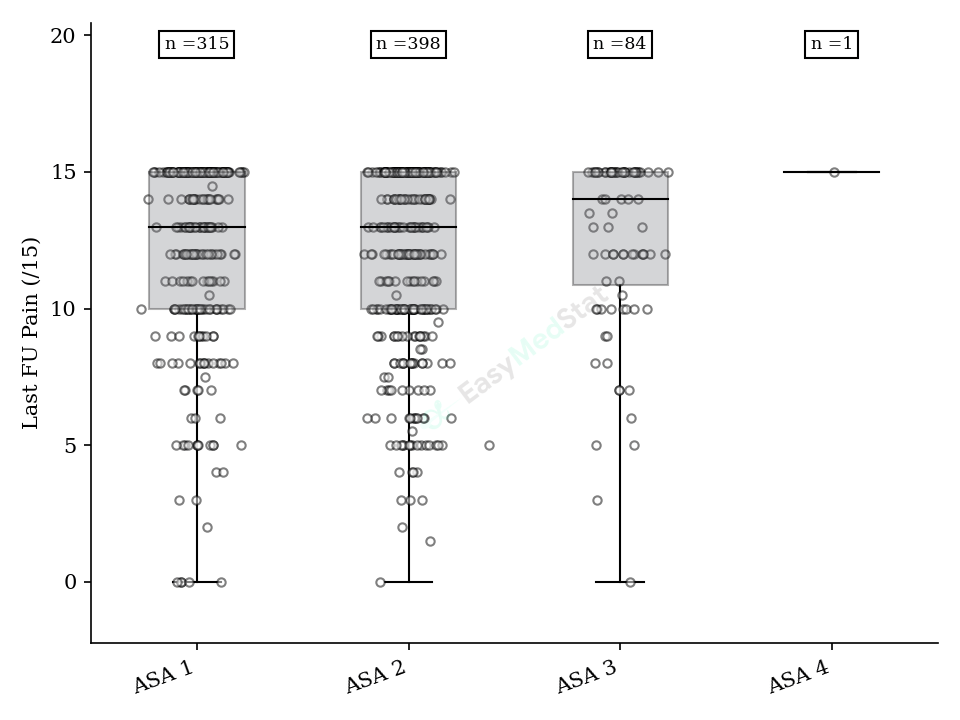
EasyMedStat automatically generates stunning charts based on your data (box plots, bar charts, dot plots, …), then lets you download them to include in an article or publication.
What is the Mann-Whitney U-test?
The Mann-Whitney U-test (also called Wilcoxon-Mann-Whitney test) is a test used in clinical research to compare two independent groups of patients. It is used in the same context as the Student t-test for independent groups. For example, it may find whether or not there is a difference in terms of age between two groups of patients.
Can I use a Student test instead of a Mann-Whitney test?
Both tests are used in medical studies to test the numeric distributions of two independent groups. However, their calculation methods are very different. Due to its parametric nature, the Student t-test cannot be used in every circumstance. When using EasyMedStat, the most appropriate test will be chosen for you automatically according to your data, so you do not have to worry if you can use the test or not. EasyMedStat does all the work for you.
In addition, when using the Student t-test, you should make sure you are using the test for independent samples. Once again, EasyMedStat takes care of this for you so you won’t make any mistakes!
Can I use a Wilcoxon’s test instead of a Mann-Whitney U-test?
No, the Wilcoxon’s signed-rank test is meant for dependent samples. The Mann-Whitney test is for independent samples. In medical research, the most common case for dependent samples is when you compare pre-treatment and post-treatment values for the same patients. EasyMedStat chooses the appropriate test for you so you do not risk using the wrong test when doing the statistics for your clinical study.
Should I display the median or the mean when using Mann-Whitney?
While the Student t-test compares the mean values of two groups, it is common to display the medians when using a Mann-Whitney U-test. This is due to the very nature of the test, which does not compare the means of the two groups but rather the rank of each patient in both samples. If the two groups that are compared have the same shape of distribution, then the Mann-Whitney U-test can be used as it compares the medians of the two groups, although that is not its primary purpose. As always, it is recommended to provide not only the p-value and the median/mean of the two groups but also some indications on the spread of the distribution: minimum, maximum, Q1 and Q3.


