A Simpler Alternative to GraphPad For Your Clinical Studies
Statistics, but simpler.
EasyMedStat allows to perform statistical analyses for medical research, without any statistical knowledge. The choice of statistical tests is fully automatized.
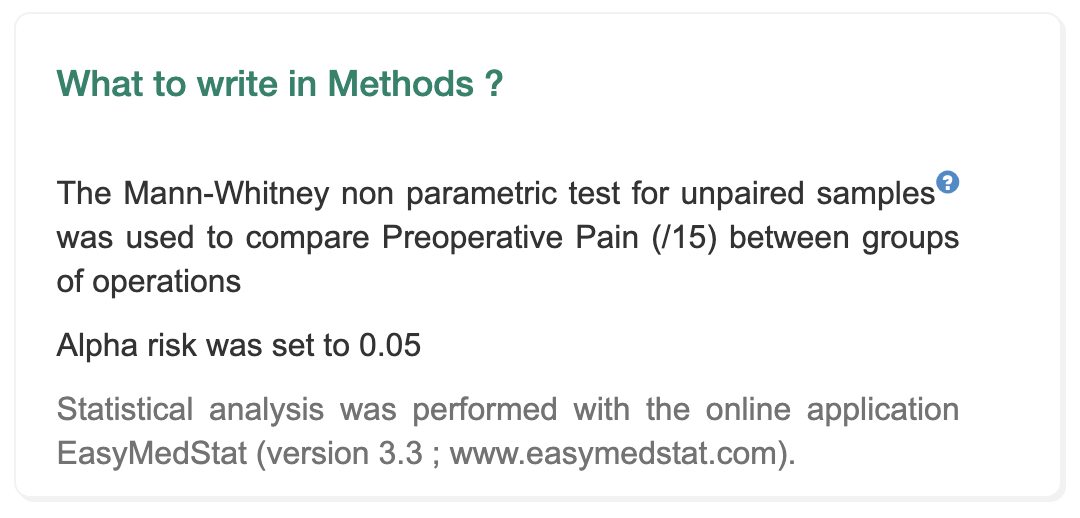
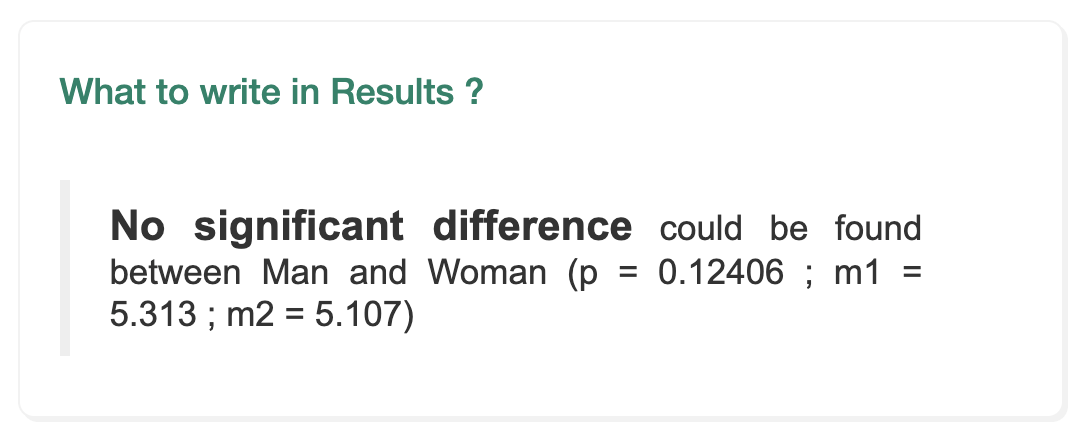
You just need to ask the clinical question. Then, EasyMedStat picks the most appropriate statistical test, calculates the p-values, generates charts and two texts: one for the methods section of your article, and one for the results section.
It is that simple.
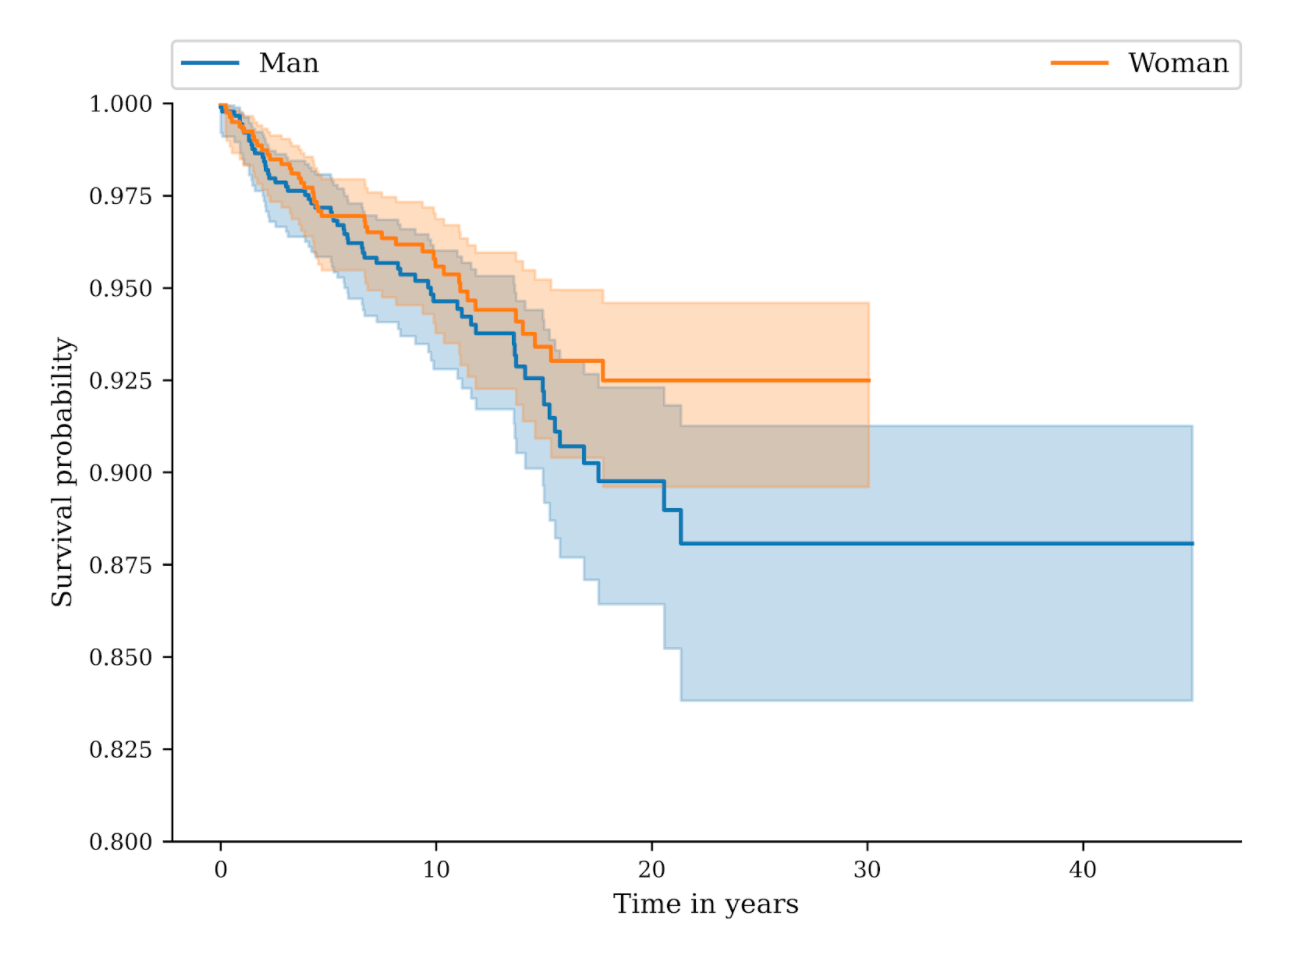
Vivid & clear professional charts
Charts are automatically generated based on your data and statistical tests.
We have carefully studied the medical literature to offer charts appropriate for high impact factor journals.
All our charts are available in high definition (600dpi) as required by scientific journals.
Automatically Generated And Authoritative Text For Your Article
You do not know what to write in the Methods section of your article ? We automatically generate the text to be written in your "Statistical analysis" section. Just copy it into your article.
Same thing for the result section. We help you avoid overinterpretation, a major source of criticism in peer reviews.
Here are the main differences between Prism GraphPad and EasyMedStat:
| EasyMedStat | GraphPad | |
|---|---|---|
| Automatic choice of statistical tests | ✔ | ✖ |
| No statistical knowledge required | ✔ | ✖ |
| No coding required | ✔ | ✔ |
| Specific for medical research | ✔ | ✖ |
| Online access | ✔ | ✖ |
| Live collaboration on a same project | ✔ | ✖ |
| Data collection tools | ✔ | ✖ |
| Automatically generated texts | ✔ | ✖ |


